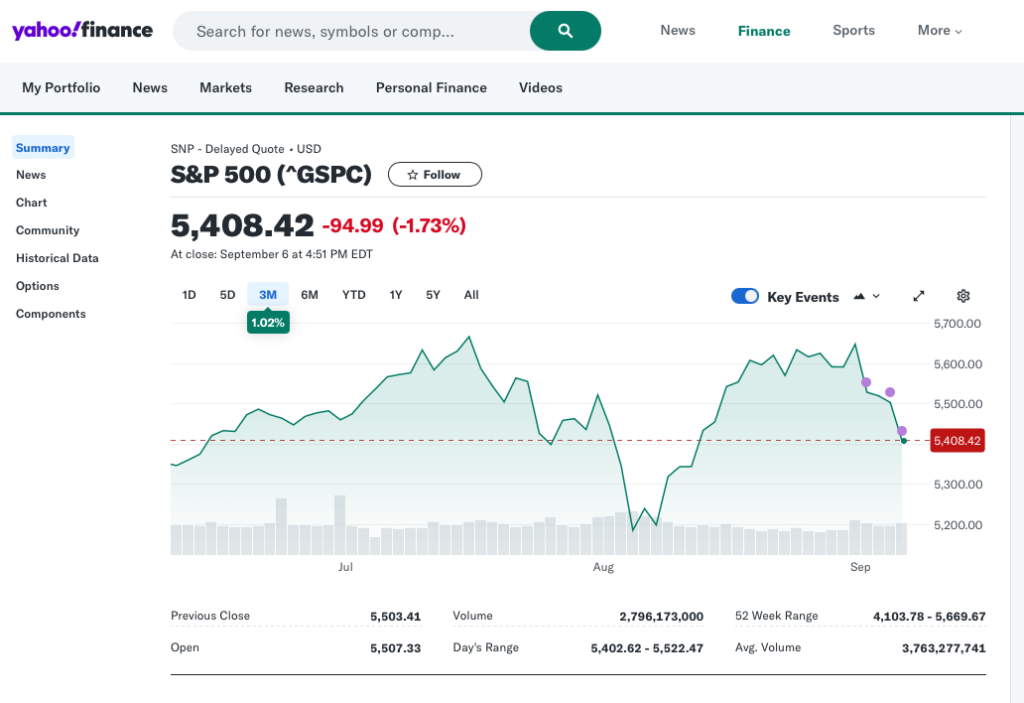
Today’s headline on Yahoo Finance

It’s been a rocky week. The S&P was down this week. It was down big in late August as well. It came back strong after the August drop, but the money we “lost” in the drop isn’t easily forgotten, whereas the gains that slowly build are less dramatic.
I wrote about this here, after the August drop and recovery. The post was called THE SKY IS FALLING!!! – PLEASE DON’T PANIC.
Market Volatility Happens
Why do I keep writing posts about this? When the market crashes, I feel like I’m the voice from the 1980 classic Airplane.
In the sky is falling post, I provided some numbers that show the impact on a $500,000 retirement portfolio. Losing $40,000 is not a small deal. It’s Ok to feel angry, disappointed, hurt… This is not cool.
And to top it off, the very serious guy in the photo in the yahoo finance article (Jerome Powell) has unanswered questions!!!
Jerome Powell knows more about the US economy and finance than you, me, and most everyone around. If he’s unsure, he must know something. Uncertainty is bad. Maybe we should get out of the market and sit in cash until some certainty returns.
Certainty Never Returns
Spoiler alert. It doesn’t. And especially with all the financial news networks and online sites trying to drum up engaging stories to attract eyeballs (and ads), it will never feel like there is certainty. And there is no certainty, ever, in the short term.
No one knows what stock prices will do tomorrow or next week. Markets do irrational things. “The market can remain irrational longer than you can remain solvent.” Seems unsure who coined this, but it is one of my favorites. Don’t bet on short term moves. It’s a gamble.
My Other Favorite Quote

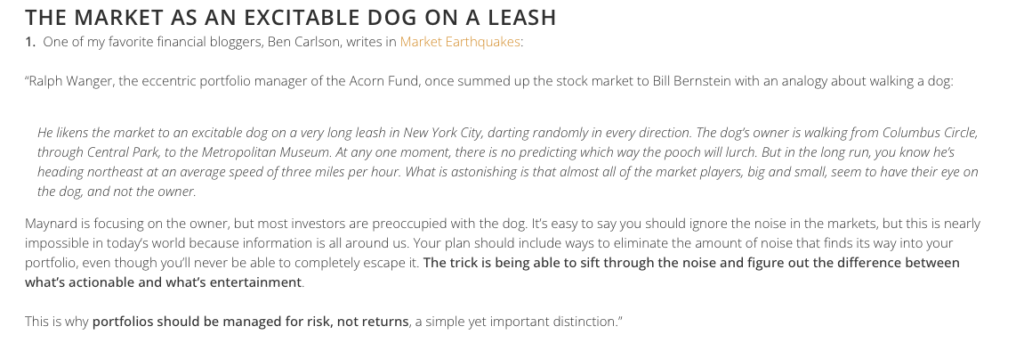
I love this. We’re all watching the daily gyrations of the market, just like the dog darting back and forth. But where is the market going in the long-term? It’s more similar to the man walking in a straight line. More data to back this up coming soon, so stay tuned.
Check out here for some more tips.
Last Few Weeks
Back to our recent volatility. Check out the S&P 500 chart.

That’s scary. That’s not what we want to see. Wouldn’t we rather see this move steadily up and to the right. More like this, right?

Imagine if the S&P 500 looked like that. That’s the type of certainty that would make me comfortable getting back in the market.
Surprise Surprise Surprise!

Hey Gomer.
The chart above is exactly that. It is the S&P 500 closing price on Oct 1 for the last 10 years.

Let’s look at the data. The gain column is the % difference from prior year, and the cumulative column is the gain difference from Oct 1, 2014. 2022 was a tough year, but other than that, each 12 month period had a positive return. And 168% return over 10 years. That’s about 16.8% average annual return per year (5,408 – 2,018 = 3,390 point gain, divided by our starting point of 2018 = 1.68 or 168%.)
What About Longer Periods?
I’m glad you asked. Let’s look at the S&P 500 since 1928.

Pretty similar story. Put that on a chart, it looks like this.

Isn’t that exactly what we want?
And remember what happened in 1929? In case you don’t it was called the great depression.

Starting in 1928, the S&P had 4 bad years right off the bat. If we had invested then, we’d have lost most of our money. Even with that horrendous start, we end up with 1,425% gain for 96 years.
But I’m not Investing for 96 years
I thought you’d say that. Remember our chart above for the last 10 years? Let’s look at some other 10 year periods:

56 to 66 was truly random, I dropped the cursor and that’s where it landed. I picked 74 to 84 to show a down period. While it is unlikely to see a 10 year period that has a decline, it can happen. And typically bad periods are followed by good ones so look at 84 to 94. And then check out the gains from 74 to 94, even with a rough 10 years.
91 to 2001 was solid, and the total over 46 years is 315%
Reinvesting Dividends
I often talk about the S&P 500 return with dividends re-invested. What you see here is strictly the price performance. I always like to reinvest my dividends in more shares. Whether I hold a mutual fund, ETF or stock, I re-invest dividends. This means every time a dividend is paid (typically every quarter), instead of getting cash in my brokerage account, I get a few more shares. This is automatic and I buy whether the price seems high or the price seems low.
Over time, I accumulate a lot more share than I started with which really improves the overall return. With dividends re-invested, we’ll see even higher return numbers.
Wrap-Up
Market certainty. We won’t ever see it in the short term. Ever.
The market will do crazy things.
When it does, I like to look at longer time spans to help put the volatility in perspective. There are plenty of sites – macrotrends, yahoo finance, etc. where we can easily get this data and draw charts and graphs to study the longer term trends.
The bottom line is that despite short-term volatility, the S&P 500 tends to rise over longer periods. This is why I like to keep money I’ll need in the short term in cash or conservative bonds. I can’t afford to have this money drop in value. But for money I won’t need for 5, 10 years, or more, I’m confident that the S&P 500 – which is an index of the 500 largetst US companies, will continue to win.
Let me know your thoughts.

