It’s April 22, 2025. The S&P 500 has had a wild ride of late. It’s down about 11% year-to-date, but that doesn’t begin to tell the story. It’s been a mad house.
Given the pain we’ve been through, it seems time to ask the big question “Is now the time to buy?”
Headlines
This has been a popular headline. Amazon has pulled back, Nvidia, Tesla…you name it, they all look like bargains. Even an investment in a nicely diversified and low-cost S&P 500 fund is likely a bargain.
The problem is that it is easy to judge a bargain based on yesterday’s prices. If we look at the iShares Core S&P 500 ETF (IVV):
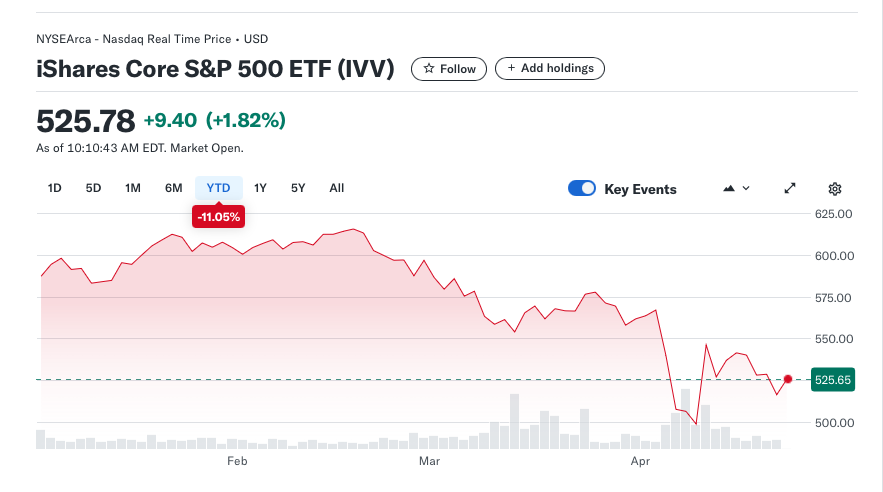
Its price is down 11.05% year-to-date. That’s a bargain.
It’s the same 500 great US companies. They’re just 11% cheaper than they were at the start of 2025.
But Part of The Chart is Missing!
That’s a nice chart, but it doesn’t show us the price of IVV tomorrow, or at the end of 2025.
$525 per share looks like a good price today compared to $587 per share at the beginning of the year. We’ll get more shares for our money. That’s good.
But what happens if we have a 2% drop tomorrow? How about if we go into a recession, or inflation remains high, or there is more tariff craziness. If this happens, the price could be a lot lower at the end of the year.
Not so much of a bargain.
It’s Impossible to Know…
…what the rest of the chart looks like.
I know that the S&P 500 price chart for 1928 to today looks like this.
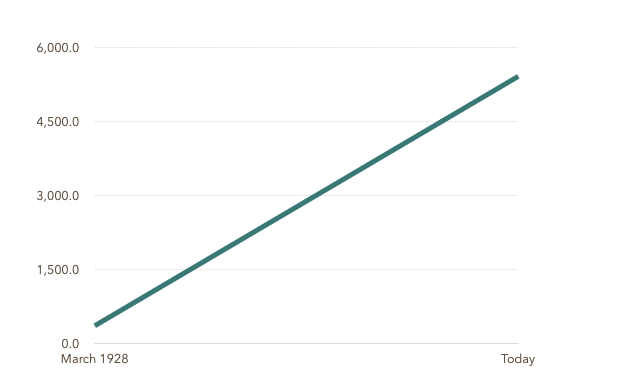
That’s awesome, but I also know the chart for this year looks exactly like the chart for IVV, which is not as cool. While the S&P 500 pulls back frequently, and we know we need to ride that out in pursuit of long-term gains, how do we navigate the volatlity? How do we know when we’ve reached bottom?
We don’t.
But their are strategies to help us.
Dollar Cost Averaging
While this sounds complicated, it’s not. Chances are if you have a workplace retirement savings plan, you’re already doing it.
Your company is nice enough to take some money out of each of your paychecks and they move it into your account in the plan. When it goes in, it buys more shares of the securities you’ve chosen. Whether the market is at top, bottom, or somewhere in the middle, you’re buying more shares.
Does it Really Work?
Let’s look at an example.
I’ve just returned from the casino and I have $700 in winnings to invest.
I’m a gambler who is conservative with my money (go figure) so I want to invest in a nice low-cost S&P 500 ETF. I choose IVV.
I open up a brokerage account, transfer the $700 in, and I buy as much IVV as I can get with $700.
Or, I could decide that I’m going to break this up into 7 equal $100 purchases to prevent me from buying all before a steep decline.
This is dollar cost averaging – what’s so hard about that.
Let’s Look at the Results
We’ll start with dollar cost averaging. Since I don’t have the IVV prices for the upcoming 7 months, we’ll look at the prior 7 months. As you know, it’s been a rocky ride.
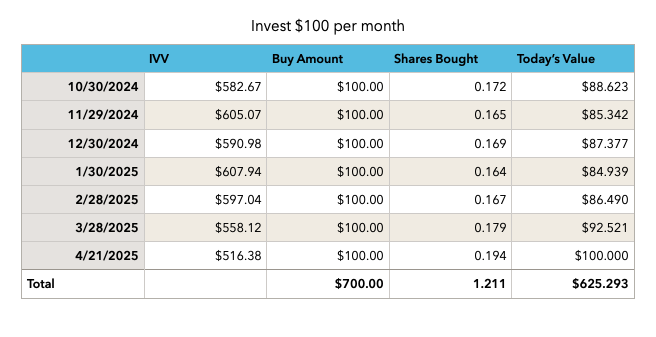
The chart below shows 7 investments of $100 each. I make my investment on the last business day of the month. I’m not trying to time my investment and choose the day after a decline, I simply buy shares on the last business day.
The IVV column is the ETF closing price on that day, the buy is always $100, and the shares bought is $100 / the price I paid.
Today’s value is the shares that I bought x today’s price.
This is a bummer. I’ve put in $700 over 7 months and I have $625.29. I’ve lost $74.71 or 10.6%.
All-In
Let’s take a look at what would have happened if I had invested the whole $700 on each of these days.
Same days and IVV closing price, but now, each of these is a $700 buy so it shows the shares I’d get with $700. And again, today’s value is the value of those shares using today’s price.
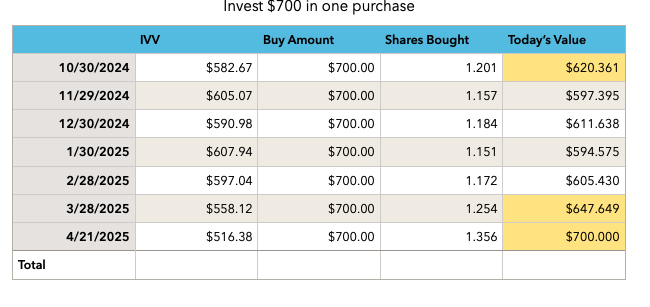
My dollar-cost-averaging result was an ending value of $625 after 7 equal purchases spaced out a month apart. 3 of the one time purchases have beaten my dollar-cost-averaging results, 4 of them have lagged behind.
Wrap-Up
This is a very small example. Typically, we’re dollar-cost-averaging over many years. In my 401k, I bought shares of the same small group of funds every month for over 20 years.
Between 1999 and 2019, there were many market pull-backs. I bought more shares on every single one of them.
There were also a lot of peaks. I bought these as well. And every purchase at peak went on to new highs.
Time is your friend.
Timing the market is hard, We’re not good at guessing the bottom or the top. But making regular investments over a long period of time shields us from going all-in at the wrong time. It also removes a lot of worry.