
I wrote about this a few months ago, here, but I’ve been thinking about how to quantify why this makes sense.
I turned 62 in May. 3 months before, in February, I gleefully logged in to the social security website and submitted my claim.
Considerations
For many of us, social security payments will be an important piece of our retirement plan. With no more paycheck, it will be important to have a dependable source of income. And especially since many folks believe they’re behind on saving, social security could be our primary source of income.
We know that the longer we wait to start taking benefits, the bigger the monthly check. How much bigger? A whopping 77%.
That means that if I get $1,500 per month at age 62, I could hold off until I’m 70 and get $2,641 per month.
Let’s Look at a Picture
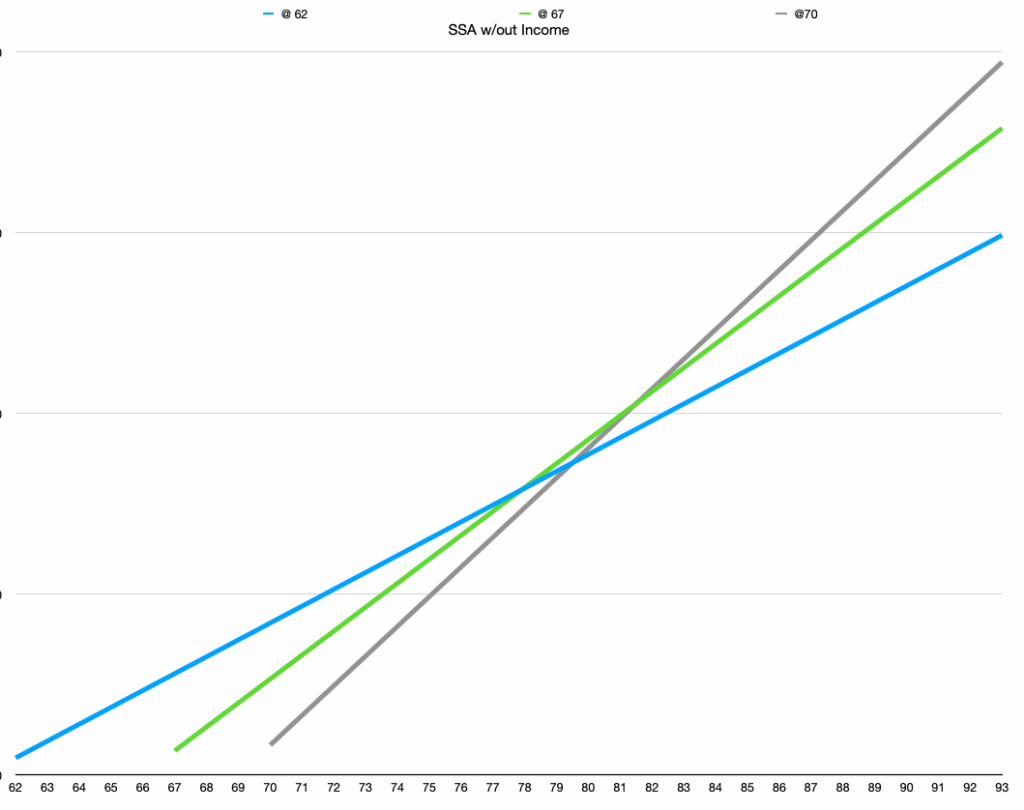
The blue line shows me taking a smaller payment at 62. The green is a slightly larger payment starting at 67 and the grey is the largest benefit if I hold out until 70,
Age 78 to 81 is the tipping point.
If I take it at 62 and live until 78, I’ll have gotten more social security than if I waited for the bigger payment at 70. If I live to 93, I would have been much better off waiting until 70.
Try This at Home
Go to the social security website and create a free account. You can see the projected amount that you’ll receive based on your current work history.
Remember, social security uses your 35 highest earning years. If you’re 50 years old with another 15 years of earnings and your salary is higher than your paper route salary at age 16, your actual payment will likely be larger.
Re-Phrase the Question
The question is always “when should I take it?” And the assumption is that I take it and spend it on my bills, and maybe some golf.
My thought is that I’ll take it and I’ll invest it.
Why?
Ideally I’d wait until I’m 70 for the 77% larger monthly check.
But cash in hand….
And we know that over the last hundred years or so, the S&P 500 has returned about 10% annually with dividends reinvested. I bet taking it at 62, not spending it, and investing it instead, will give me more money than if I waited until age 70.
The Test
Since I can’t look up the S&P 500 prices for the coming 8 years, I’ll do the next best thing.
Let’s assume I’m going to invest in the iShares Core S&P 500 ETF (IVV). My plan is to take my social security check and use the entire proceeds to buy shares of IVV.
I went back to 9/1/2017. This is 8 years ago.
I planned to see what kind of a nest egg I could build by investing my social security check and how much this might offset the difference had I waited until 70 for the larger check.
I entered the closing price of IVV on the first business day of each month, all the way up to August 2025.
I then took my theoretical $1,500 social security check and bought shares of IVV. I calculated $1,500 / that day’s closing price of IVV to determine how many shares I bought. Here’s the data.
| Date | IVV Price at Close | SS Check | Shares |
| 2017-09-01 | 252.93 | $1,500.00 | 5.930 |
| 2017-10-02 | 258.81 | $1,500.00 | 5.796 |
| 2017-11-01 | 266.89 | $1,500.00 | 5.620 |
| 2017-12-01 | 268.85 | $1,500.00 | 5.579 |
| 2018-01-01 | 284.15 | $1,500.00 | 5.279 |
| 2018-02-01 | 273.34 | $1,500.00 | 5.488 |
| 2018-03-01 | 265.37 | $1,500.00 | 5.652 |
| 2018-04-02 | 266.31 | $1,500.00 | 5.633 |
| 2018-05-01 | 272.73 | $1,500.00 | 5.500 |
| 2018-06-01 | 273.05 | $1,500.00 | 5.493 |
| 2018-07-02 | 283.28 | $1,500.00 | 5.295 |
| 2018-08-01 | 292.44 | $1,500.00 | 5.129 |
| 2018-09-03 | 292.73 | $1,500.00 | 5.124 |
| 2018-10-01 | 272.76 | $1,500.00 | 5.499 |
| 2018-11-01 | 278.00 | $1,500.00 | 5.396 |
| 2018-12-03 | 251.61 | $1,500.00 | 5.962 |
| 2019-01-01 | 271.55 | $1,500.00 | 5.524 |
| 2019-02-01 | 280.32 | $1,500.00 | 5.351 |
| 2019-03-01 | 284.56 | $1,500.00 | 5.271 |
| 2019-04-01 | 295.94 | $1,500.00 | 5.069 |
| 2019-05-01 | 277.30 | $1,500.00 | 5.409 |
| 2019-06-03 | 294.75 | $1,500.00 | 5.089 |
| 2019-07-01 | 299.23 | $1,500.00 | 5.013 |
| 2019-08-01 | 294.27 | $1,500.00 | 5.097 |
| 2019-09-02 | 298.52 | $1,500.00 | 5.025 |
| 2019-10-01 | 304.97 | $1,500.00 | 4.919 |
| 2019-11-01 | 316.06 | $1,500.00 | 4.746 |
| 2019-12-02 | 323.24 | $1,500.00 | 4.641 |
| 2020-01-01 | 323.24 | $1,500.00 | 4.641 |
| 2020-02-03 | 295.91 | $1,500.00 | 5.069 |
| 2020-03-02 | 258.40 | $1,500.00 | 5.805 |
| 2020-04-01 | 291.16 | $1,500.00 | 5.152 |
| 2020-05-01 | 305.18 | $1,500.00 | 4.915 |
| 2020-06-01 | 309.69 | $1,500.00 | 4.844 |
| 2020-07-01 | 327.82 | $1,500.00 | 4.576 |
| 2020-08-03 | 350.77 | $1,500.00 | 4.276 |
| 2020-09-01 | 336.06 | $1,500.00 | 4.463 |
| 2020-10-01 | 327.62 | $1,500.00 | 4.578 |
| 2020-11-02 | 363.32 | $1,500.00 | 4.129 |
| 2020-12-01 | 375.39 | $1,500.00 | 3.996 |
| 2021-01-01 | 371.52 | $1,500.00 | 4.037 |
| 2021-02-01 | 381.77 | $1,500.00 | 3.929 |
| 2021-03-01 | 397.82 | $1,500.00 | 3.771 |
| 2021-04-01 | 418.88 | $1,500.00 | 3.581 |
| 2021-05-03 | 421.65 | $1,500.00 | 3.557 |
| 2021-06-01 | 429.92 | $1,500.00 | 3.489 |
| 2021-07-01 | 440.40 | $1,500.00 | 3.406 |
| 2021-08-02 | 453.71 | $1,500.00 | 3.306 |
| 2021-09-01 | 430.82 | $1,500.00 | 3.482 |
| 2021-10-01 | 460.99 | $1,500.00 | 3.254 |
| 2021-11-01 | 457.63 | $1,500.00 | 3.278 |
| 2021-12-01 | 476.99 | $1,500.00 | 3.145 |
| 2022-01-03 | 451.77 | $1,500.00 | 3.320 |
| 2022-02-01 | 438.72 | $1,500.00 | 3.419 |
| 2022-03-01 | 453.69 | $1,500.00 | 3.306 |
| 2022-04-01 | 413.56 | $1,500.00 | 3.627 |
| 2022-05-02 | 414.87 | $1,500.00 | 3.616 |
| 2022-06-01 | 379.15 | $1,500.00 | 3.956 |
| 2022-07-01 | 414.28 | $1,500.00 | 3.621 |
| 2022-08-01 | 397.18 | $1,500.00 | 3.777 |
| 2022-09-01 | 358.65 | $1,500.00 | 4.182 |
| 2022-10-03 | 387.79 | $1,500.00 | 3.868 |
| 2022-11-01 | 409.32 | $1,500.00 | 3.665 |
| 2022-12-01 | 384.21 | $1,500.00 | 3.904 |
| 2023-01-02 | 408.31 | $1,500.00 | 3.674 |
| 2023-02-01 | 397.97 | $1,500.00 | 3.769 |
| 2023-03-01 | 411.08 | $1,500.00 | 3.649 |
| 2023-04-03 | 417.66 | $1,500.00 | 3.591 |
| 2023-05-01 | 419.43 | $1,500.00 | 3.576 |
| 2023-06-01 | 445.71 | $1,500.00 | 3.365 |
| 2023-07-03 | 460.18 | $1,500.00 | 3.260 |
| 2023-08-01 | 452.69 | $1,500.00 | 3.314 |
| 2023-09-01 | 429.43 | $1,500.00 | 3.493 |
| 2023-10-02 | 419.94 | $1,500.00 | 3.572 |
| 2023-11-01 | 458.42 | $1,500.00 | 3.272 |
| 2023-12-01 | 477.63 | $1,500.00 | 3.141 |
| 2024-01-02 | 485.20 | $1,500.00 | 3.092 |
| 2024-02-01 | 510.45 | $1,500.00 | 2.939 |
| 2024-03-01 | 525.73 | $1,500.00 | 2.853 |
| 2024-04-01 | 504.44 | $1,500.00 | 2.974 |
| 2024-05-01 | 529.96 | $1,500.00 | 2.830 |
| 2024-06-03 | 547.23 | $1,500.00 | 2.741 |
| 2024-07-01 | 553.32 | $1,500.00 | 2.711 |
| 2024-08-01 | 566.75 | $1,500.00 | 2.647 |
| 2024-09-03 | 576.82 | $1,500.00 | 2.600 |
| 2024-10-01 | 571.24 | $1,500.00 | 2.626 |
| 2024-11-01 | 605.07 | $1,500.00 | 2.479 |
| 2024-12-02 | 588.68 | $1,500.00 | 2.548 |
| 2025-01-02 | 604.66 | $1,500.00 | 2.481 |
| 2025-02-03 | 597.04 | $1,500.00 | 2.512 |
| 2025-03-03 | 561.90 | $1,500.00 | 2.670 |
| 2025-04-01 | 557.96 | $1,500.00 | 2.688 |
| 2025-05-01 | 592.15 | $1,500.00 | 2.533 |
| 2025-06-02 | 620.90 | $1,500.00 | 2.416 |
| 2025-07-01 | 634.90 | $1,500.00 | 2.363 |
| 2025-08-01 | 645.64 | $1,500.00 | 2.323 |
| $144,000.00 | 387.169 |
That’s a lot, so let’s summarize.
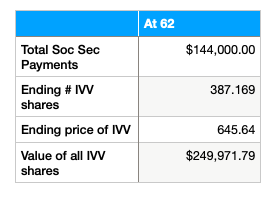
The at 62 table summarizes the big table above. 96 payments (8 years) of $1,500 monthly payments totals $144,000. I use each monthly check to buy shares of IVV. Based on historical prices, I would have ended with over $249,000.
How Do I Compare?
In the scenario above, I arrive at age 70 with a nest egg of $249,971 invested in IVV. I’ve also locked in a lifetime of $1,500 per month payments.
Had I waited, I’d have no nest egg, but a payment of $2,655 (77% higher than $1,500) each month for life.
The difference between $1,500 and $2,655 is $1,155. That’s what I need to make up with my nest egg in order to live the same lifestyle.
$249,971 / $1,155 is 216. That means that I could take out $1,155 every month for 216 months to make up that difference. 216 months is 18 years.
So if I live to 88, taking the money at 62 and investing is a better deal, based on historic results.
And, this is true if I took the $249,971 and moved it into a savings account when I turned 70. What’s more likely is that I have an asset allocation plan where I take the money that I need in the next 5 years and move it to cash, but I leave the rest in a mix of IVV and maybe a bond fund so that it continues to grow.
Wrap Up
Some of you are saying “I need that money at 62 to pay bills.” That’s cool. If that’s the case, your decision is made. Take it at 62.
This is an alternative for all those who are agonizing over spreadsheets and pouring over family history to try to determine how long they’ll live.
I believe that there is a good chance that if we take the money at 62 and put it in a nice low-cost S&P 500 fund, we’ll be better off than if we waited until 70.
The added benefit of this approach is that by taking the money at 62, we have control. If an emergency comes up, we can dip into these funds. If we wait until 70, we have nothing until that first payment starts 1 month after our 70th birthday.